The Story
First time post, long time coach and software developer. This is the story of last year's team, and how we went from 6 goals against to 1.5, and why the process eventually turned into the software I developed for this upcoming season.
Last year we had the weakest team on paper in our loop and couldn't out-skill anyone, so we committed to a defense-first approach. When relying on instinct wasn't working, we turned to data—tracking shot locations, on-ice players, and goal contexts using printed rink sheets, pens, and video replays.
Diagnosing the Problem
By tracking three basic data points (shot count, shot location, and on-ice personnel), three critical insights emerged:
-
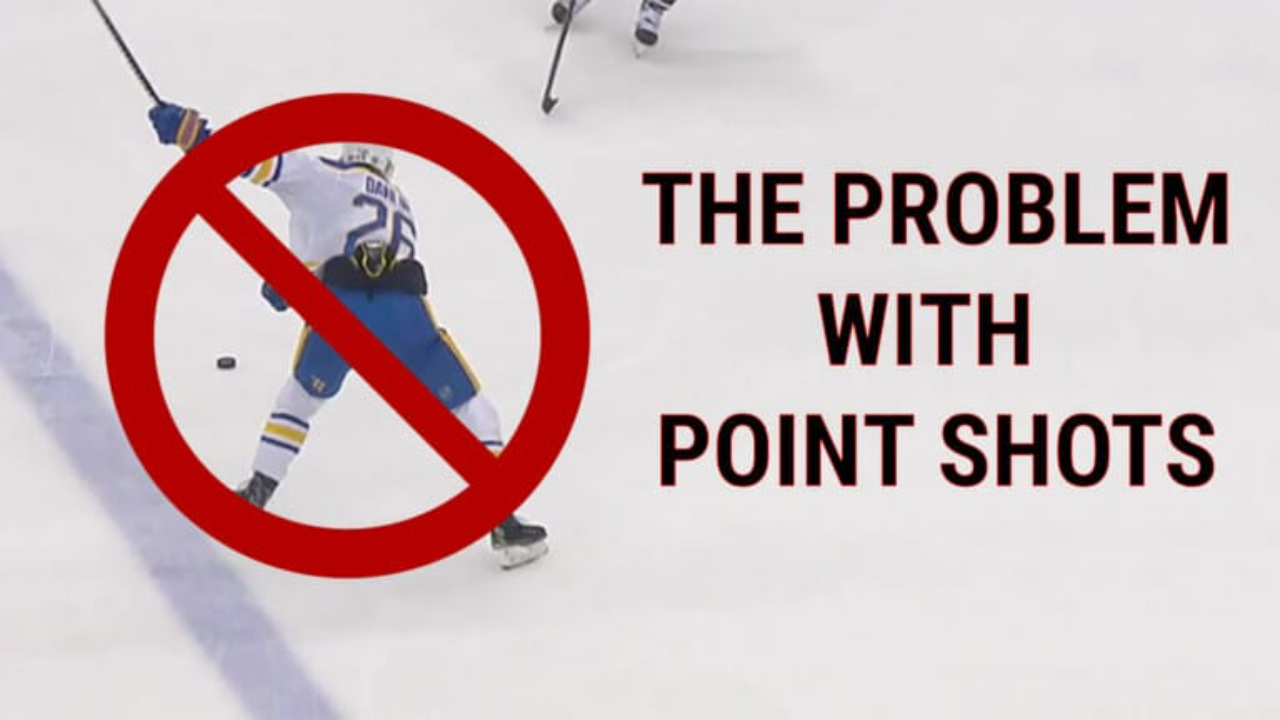
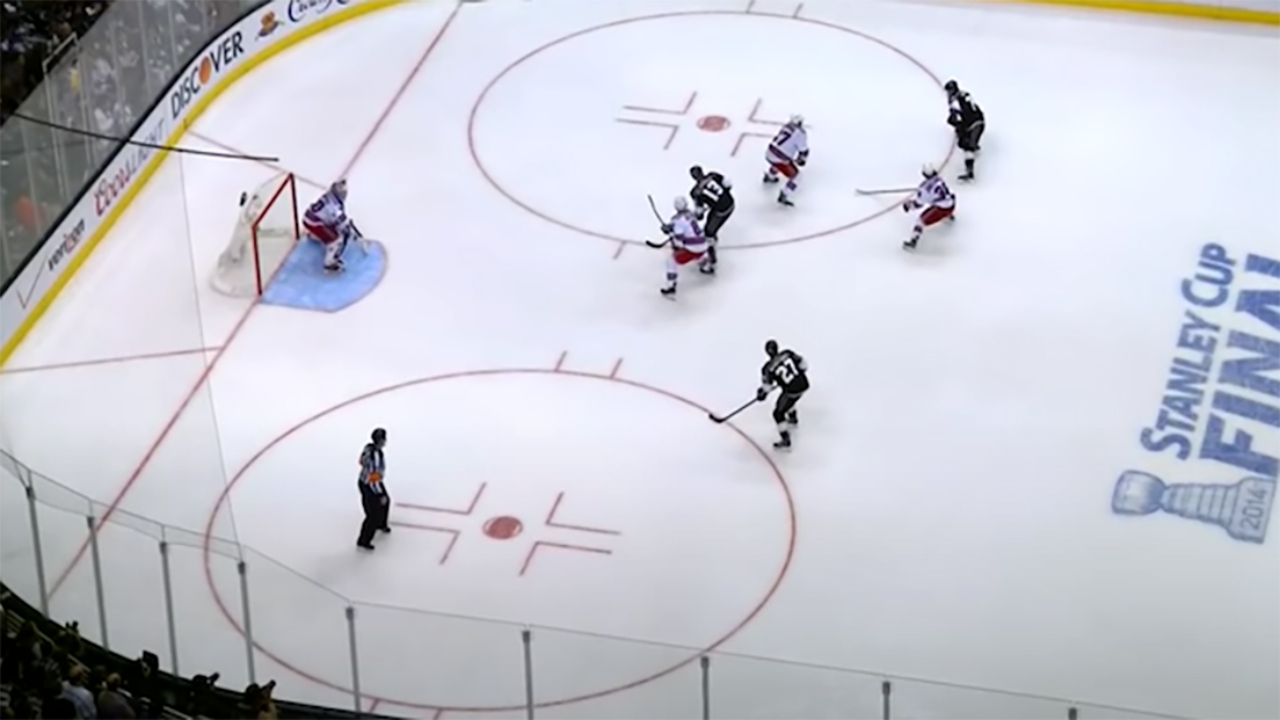
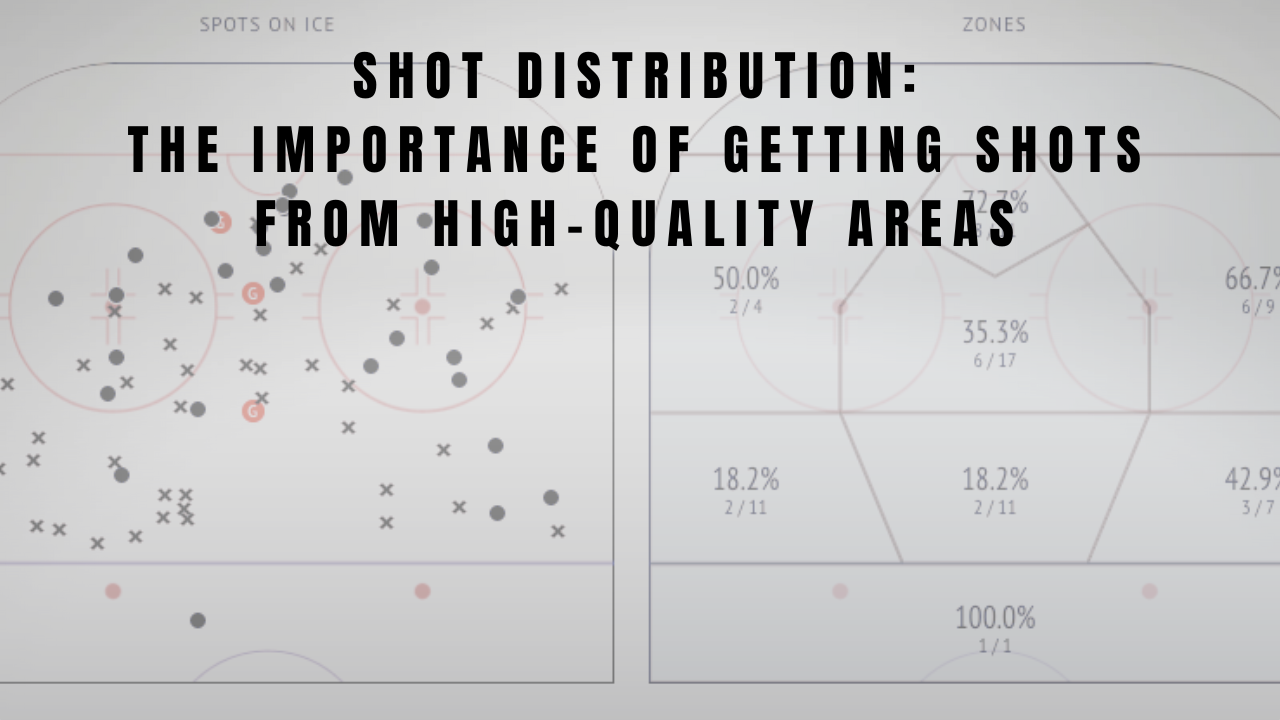
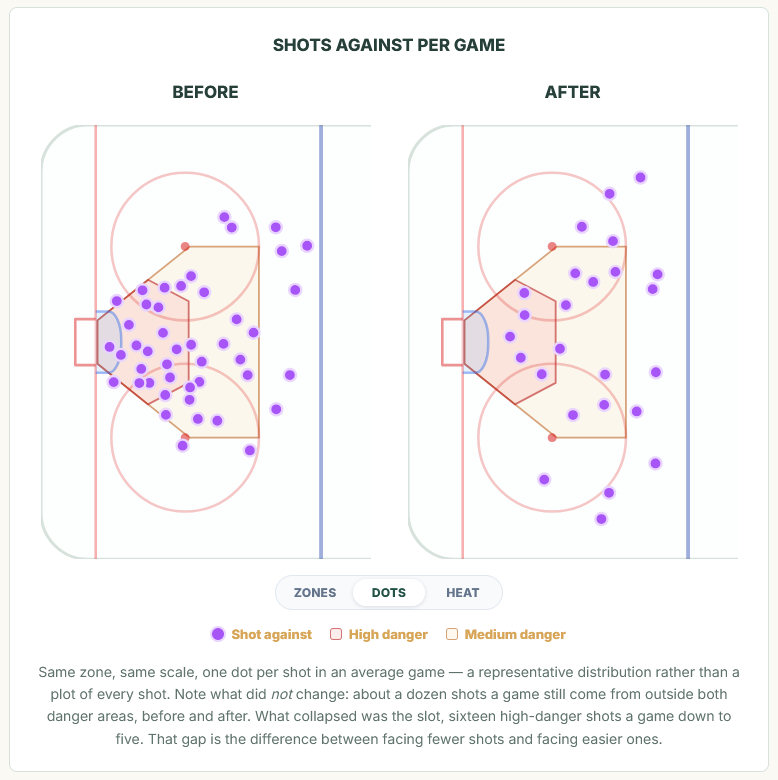
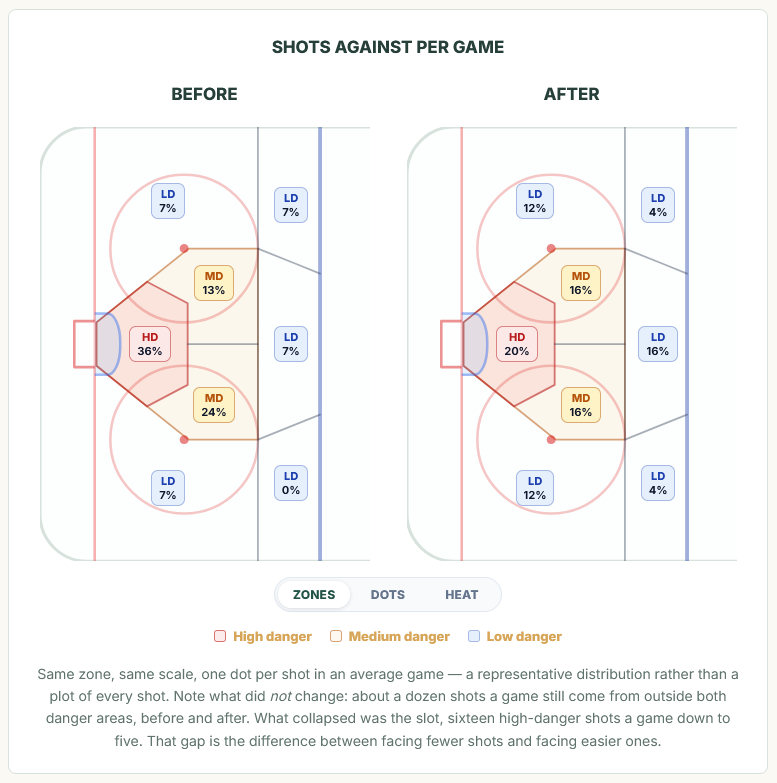
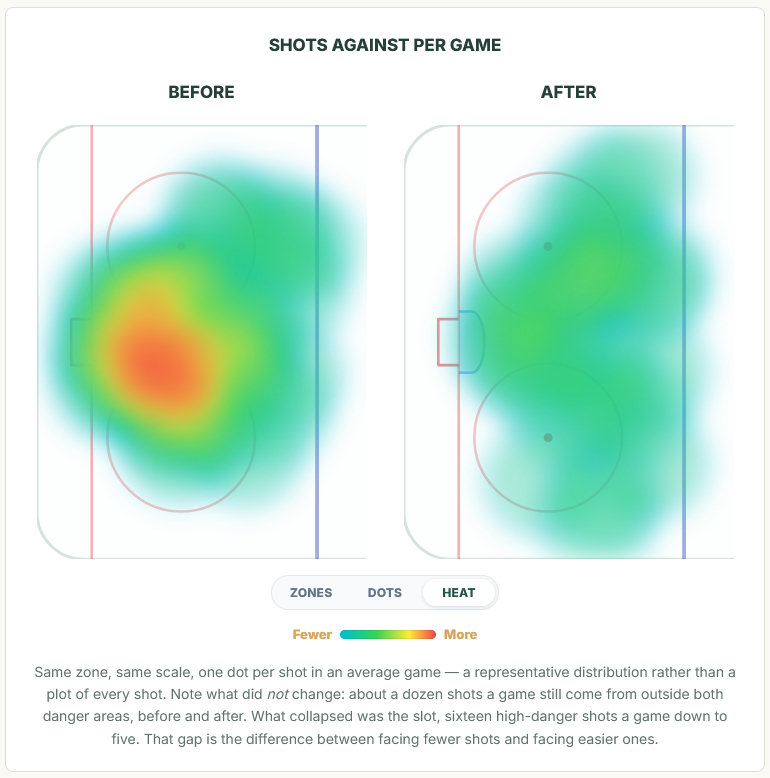
Location Over Perimeter: We were giving up 45 shots a game, with almost all goals coming from high-danger areas down low (below the circles and near the net), not from the point.
-
Personnel Context: Breakdowns consistently targeted one side of our zone. Tracking who was on the ice gave us a clear coaching list to fix specific habits and pairings—not to bench players, but to target development.
-
Exonerating the Goalie: High shot volume and point-blank chances were destroying our goalie’s save percentage. He wasn't letting in bad goals; he was facing an overwhelming number of high-danger ones.
The Tactical Fix & Implementation
We made a deliberate tradeoff: give up the points to own the house.
-
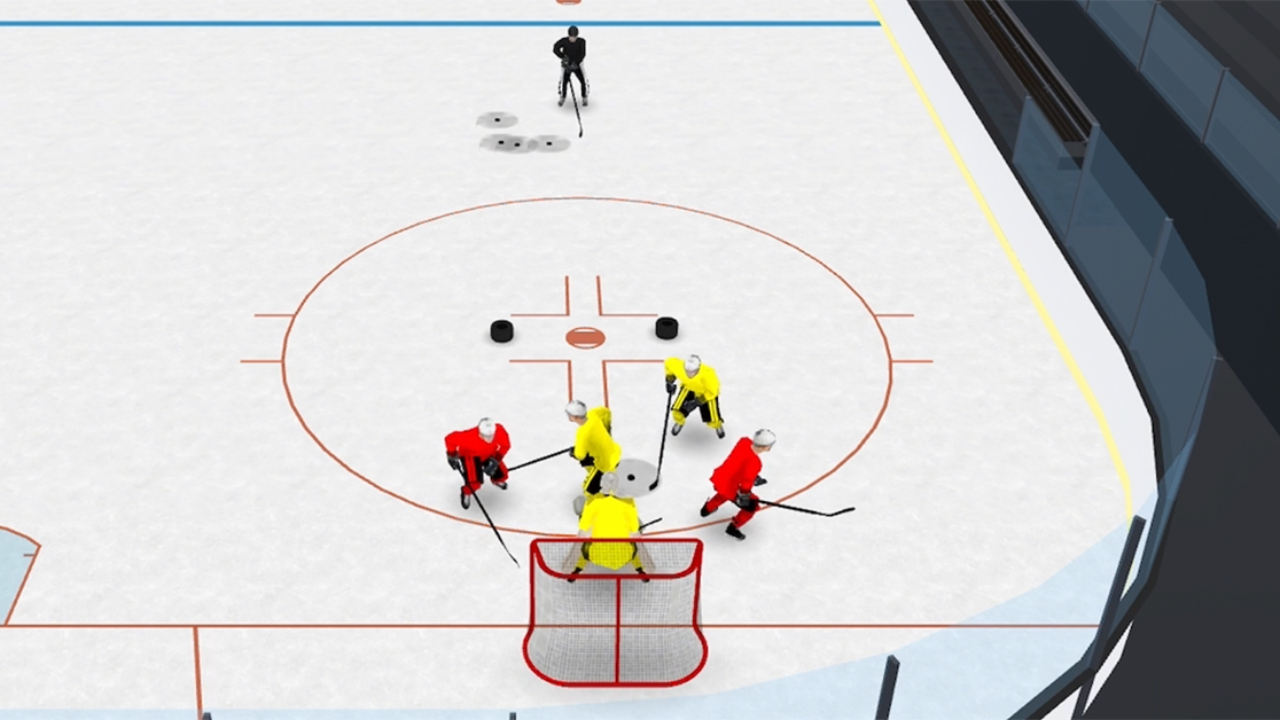
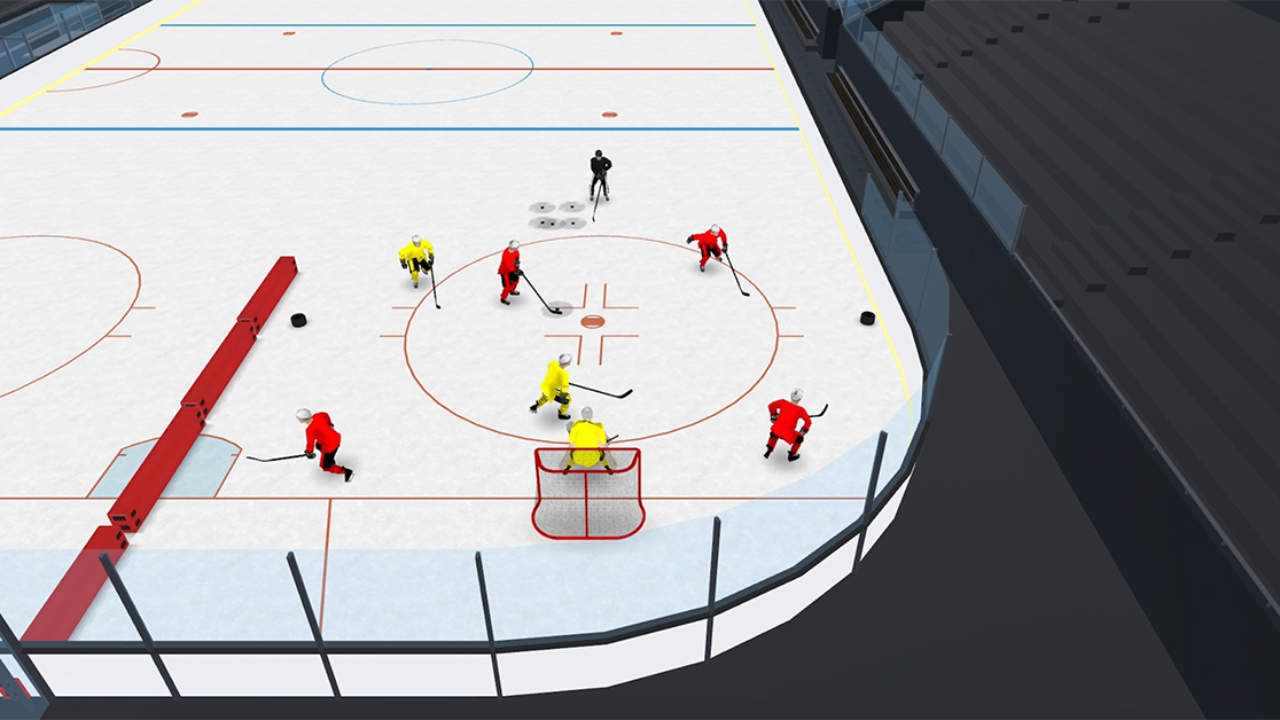
The Tactical Adjustment: Wingers collapsed low into a tight defensive box to cover the slot and net front, conceding perimeter point shots. This downgraded shot quality and eliminated screen, rebound, and second-chance sequences.
-
Player Buy-In:
-
Visual Evidence: Showed players marked-up shot maps to visually prove where goals originated.
-
Chalk Talks: Explained why giving up low-percentage point shots was a winning trade-off.
-
Repetition: Ran weekly small-area defensive drills to build lasting habits.
-
The Results
Over the final 10 games of the season, the structural shift dramatically transformed our performance:
| Metric | Before | After |
| Goals Against / Game | 6.0 | 1.5 |
| Shots Against / Game | 45 | 25 |
| GA from High-Danger | 63% | 25% |
| Goalie Save % | .842 | .940 |
The goalie's performance jumped significantly without changing his play—cleaning up the net front fixed his season.
Why It Became Software
While watching video and logging basic data was easy, the downstream manual work—hand-drawing diagrams, re-tallying spreadsheets, and manually spotting trends—was tedious.
Stats Beaver was built to automate that manual labor. Simple inputs turn into instant, actionable coaching insights:
-
Printed Rink Sheets became Team Shot Maps
-
On-Ice Tallies became On-Ice Impact Pages
-
Player Groupings became Line Chemistry Analysis
-
Shot Quality Audits became Goalie Save Quality Metrics
-
Weekly Re-tallies became Player Trend Tracking
The goal isn't pro-level analytics for its own sake—it's giving coaches a tool to pinpoint their team's exact problems, target fixes immediately, and track progress within weeks.
Coach Team Workspace
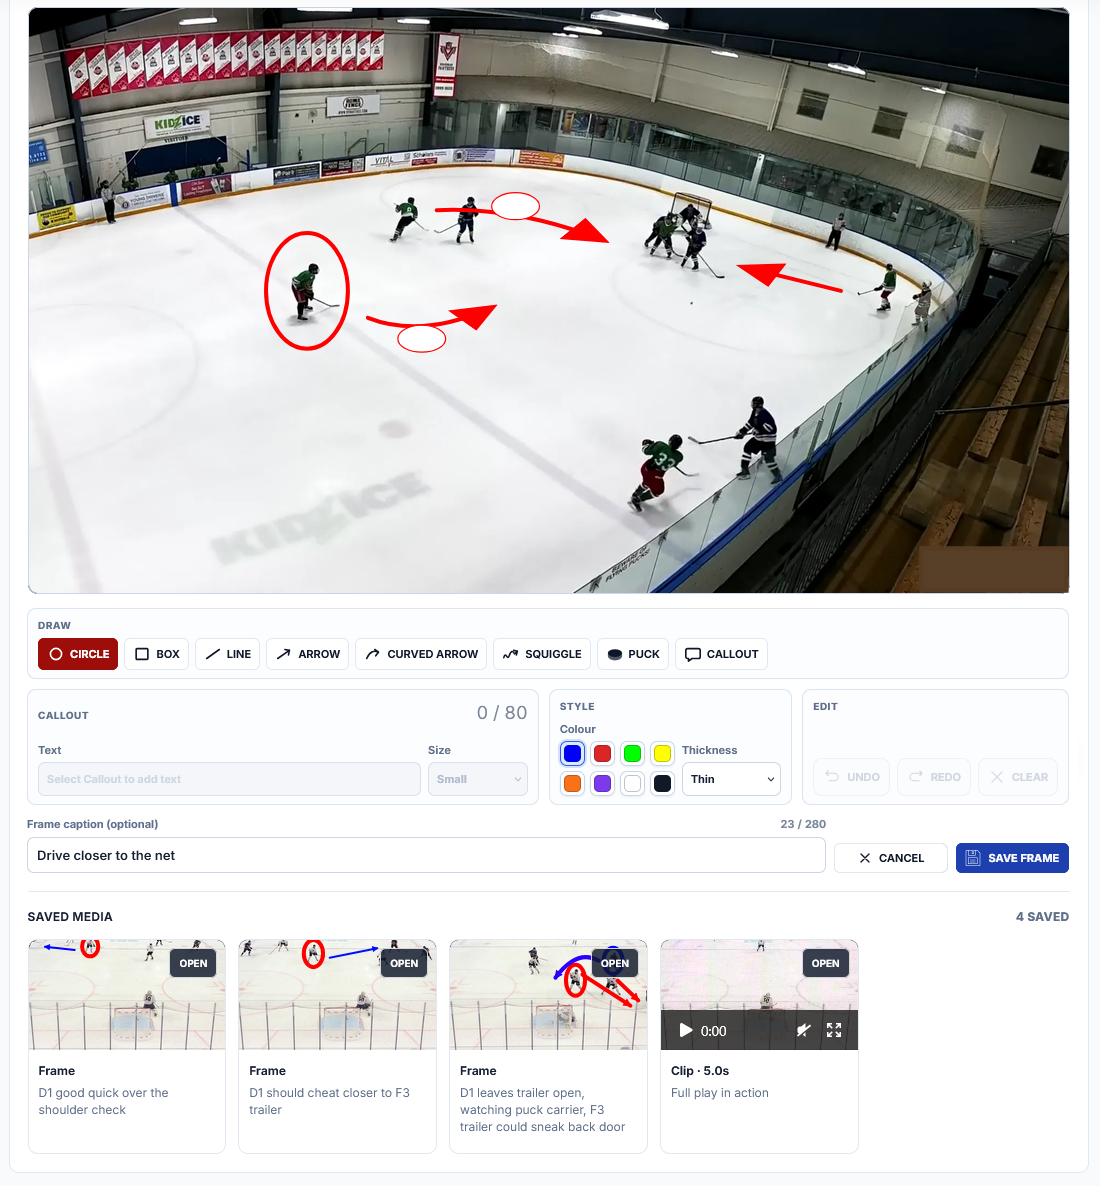
Since then the app has become a full team workspace, bringing per game events, coaches notes, and review footage together under one private roof. Simple input, instant coaching clarity.
Get The App