My dad, for what seemed like a bajillion years, was the Director of Chicago Regional Recruitment for a small, private NCAA D3 University in the middle of the state of Illinois. I got to grow up watching and learning from every coach at every sport that used our house as hub to visit high schools in the area. Some nights the football coaches would sleep on an air mattress in our basement; earlier in my life they'd sleep on the pullout couch bed with the infamous back-breaking bar of doom. Sometimes the basketball coaches would play NBA Live with me on Playstation 1. But I always liked to hear the chats going on in our house.
As I got older, some of these coaches ended up at major universities - coaching or recruiting at places like Miami, Army, Ohio State and Notre Dame. I got to see THOSE recruiting calls up close and personal. A running back flipping his commitment to go to a rival Big Ten school, a coup getting an SEC-caliber tight end to go to a MAC school, etc.
I gained really fascinating insights into a world that I've now since entered as an ACHA coach that happens to work for a fully-funded and school-run hockey program.
I get to recruit like my heroes. And it has come at a massive, massive learning curve. In my handful of years recruiting college-level players, I've come to learn that The Times They Are a-Changin'.
For years, the prevailing rule of thumb in junior hockey went something like this:
The best players from Tier III teams play NCAA Division III hockey. The next tier plays ACHA, and so on.
It was simple. It was intuitive. And at one point, it was directionally useful. Me and 50 other guys would compete for the same caliber of player at various showcases or a coach would let us know a player is available (usually meaning they didn't have any D3 offers) and then the best ACHA offer would win most of the time. Fortunately, we have a lot to provide players and so getting players to join us has been easier than some have had it. I also tend to think the recruiters make their own luck a bit too... but that's for another article.
Anyway, junior hockey — and college hockey — do not operate in that world anymore.
Over the last several seasons, three forces have quietly but fundamentally altered the landscape:
-
Roster-slot pressure at the NCAA Division III level
-
The continued expansion and stratification of junior hockey
-
The growth, funding, and legitimacy of ACHA hockey as a parallel pathway
Add to that the impending eligibility of CHL players for NCAA hockey, and the pressure becomes impossible to ignore.
This piece lays out a pressure model, grounded in player-level data, that shows where Tier III players actually land — team by team, league by league — and why expectations around Tier III → NCAA Division III outcomes need to be recalibrated.
Importantly, this is not an argument against Tier III hockey.
It is an argument for accuracy of expectations.
Defining the Scope (Before We Start)
To keep this analysis honest and aligned with how coaches and advisors actually think, I am making one key distinction:
-
Tier III (Core): NA3HL + USPHL Premier
-
Tier III+ (Bridge): EHL (treated separately, excluded from core Tier III conclusions)
Lumping all Tier III leagues together muddies the signal and inflates expectations. I am of the belief that the EHL is not better or worse than the other two leagues, but it is different. Regionally it is located closer to most NCAA D3 hockey programs and rosters skew older. This matters.
From here forward, when we say Tier III, we mean NA3HL and USPHL Premier only.
The Fixed Pie: NCAA Division III Roster Reality
NCAA Division III men’s hockey has roughly 2,650 active roster spots nationally.
Those spots are not expanding.
When we normalize by a conservative four-year average roster tenure, that yields:
-
~660 new D3 roster slots per year across the entire country
From the '25-26 data:
-
386 active NCAA D3 players came from NA3HL or USPHL Premier
Annualized:
-
~97 new NCAA D3 slots per year for all NA3HL + USPHL Premier players combined
That number — under 100 seats per year — is the foundation of the pressure model.
Everything else flows from it.
What That Looks Like Per Team
Spread those ~97 annual slots across:
-
~38 NA3HL teams
-
~80+ USPHL Premier teams
You get a sobering baseline:
-
~0.8 NCAA D3 players per team, per year
That is a bottleneck.
And even that assumes an even distribution — which the data shows is not how reality works.
Where Tier III Players Actually Land Inside NCAA Division III
When we map Tier III (NA3HL + USPHL Premier) representation against MYHockeyRankings NCAA D3 team strength, a pattern emerges.
Chart: Tier III Representation vs Team Rank
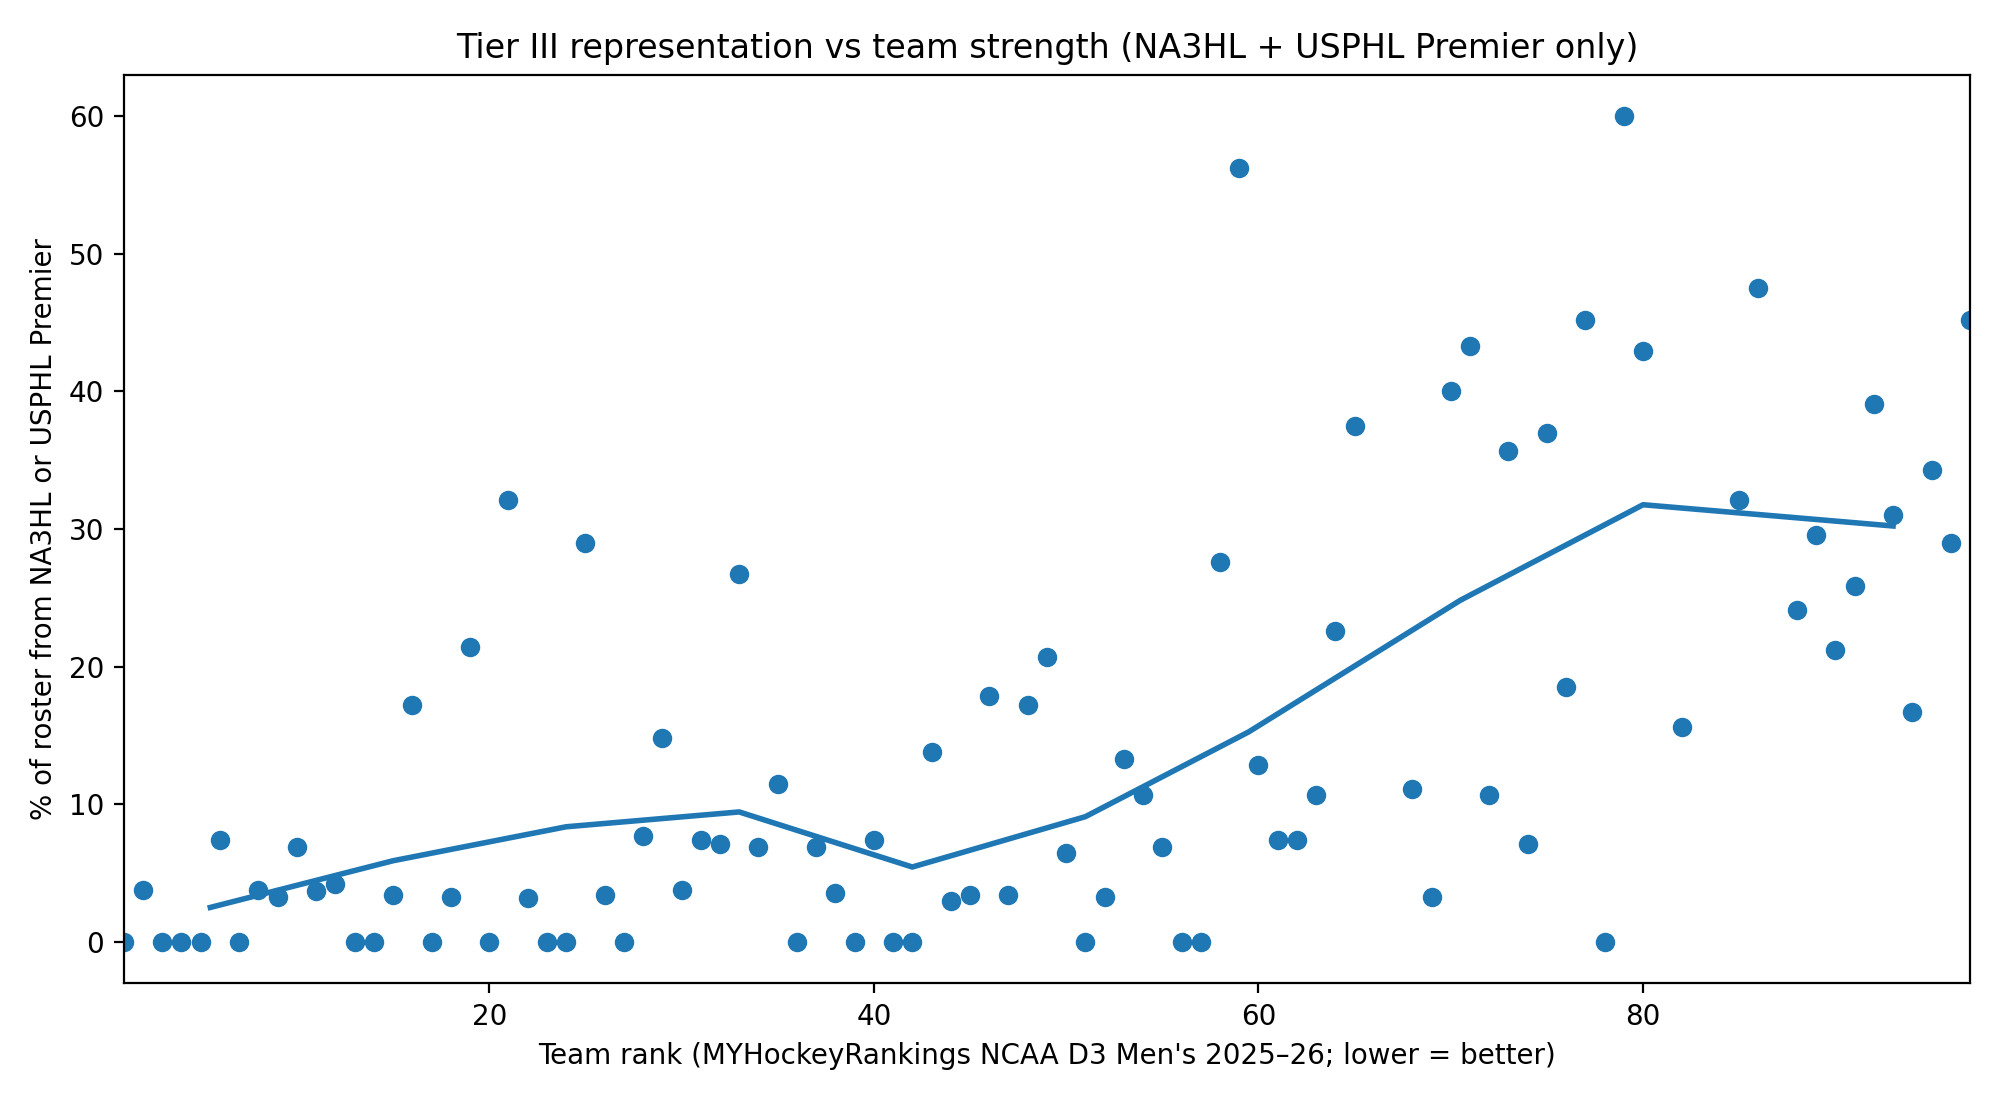
[Chart: Tier III % of roster vs MYHockeyRankings rank]
What this chart shows:
-
Top NCAA D3 programs: effectively zero Tier III (core) players
-
Middle tier: sporadic, inconsistent representation
-
Bottom tier: Tier III players dominate roster composition
The Elite Split: Top vs Bottom
When we isolate the extremes:
Top 10 NCAA Division III Programs
-
Core Tier III share of roster: ~0–1%
-
Most rosters contain zero NA3HL or USPHL Premier players
Bottom 10 NCAA Division III Programs
-
Core Tier III share of roster: ~60%+
Tier III players do reach NCAA Division III.
But overwhelmingly, they do so in the lower tier of the division.
That distinction is almost never made in placement graphics — and it is the most important one.
Aggregated Placement Graphics Can Mislead
When a junior program advertises:
“20 NCAA Division III placements”
What that often means in practice:
-
Spread across many birth years
-
Spread across many seasons
-
Concentrated in the lower tier of NCAA D3
-
Translating to ~1 player per year or less
Aggregation hides both volume reality and quality of landing spot.
The pressure model forces us to ask better questions:
-
How many per year?
-
From which league?
-
To which tier of NCAA D3?
Why This Pressure Increases — Not Decreases
All of this is before accounting for:
-
CHL eligibility entering the NCAA ecosystem
-
Continued junior expansion at Tier II
-
Transfer behavior inside NCAA hockey
The number of NCAA D3 roster seats does not change.
Competition for those seats does.
Pressure flows downhill.
Tier III feels it first.
The Implication for Players, Families, and Advisors
The takeaway should not be pessimistic.
For exceptional NA3HL and USPHL Premier players:
-
NCAA Division III is one possible outcome
-
It is no longer the default
-
And when it exists, it is far more likely to be:
-
lower-tier competitively
-
high-cost institutionally
-
not meaningfully superior in experience or value to ACHA options
-
This is why ACHA hockey must be discussed as a parallel pathway, not a consolation prize.
There are many programs under the ACHA banner that have similar (or better) resources as NCAA D3 teams. You ever see Liberty Unversity's locker room?
The market has already moved.
The messaging to players and families just hasn’t caught up yet.
The Pressure Is Already Visible at NCAA Division I
The Tier III pressure model does not exist in isolation. It is the downstream result of forces already at work higher up the college hockey pyramid — particularly at NCAA Division I.
Several structural signals at the D1 level matter directly to the future of Tier III pathways:
1) A New Supply Shock at the Top
Beginning in 2025–26, CHL players became eligible for NCAA Division I hockey. This represents a meaningful increase in the supply of older, experienced, professionally trained players competing for a fixed number of D1 roster spots.
While CHL players (for now, and probably not much longer) remain ineligible for NCAA Division III, the impact does not stop at Division I. When D1 recruiting pools deepen, marginal D1 recruits are displaced, not eliminated — and those players re-enter the ecosystem elsewhere.
2) The Transfer Portal as a Roster-Building Tool
NCAA Division I hockey now uses the transfer portal as a primary roster-management mechanism, not a secondary one. Coaches increasingly fill needs with older, proven players rather than projecting long-term development on younger recruits.
This shortens the runway for developmental players at the D1 level and reduces the number of "open" freshman slots in any given year.
3) Older Rosters, Fewer New Seats
Independent tracking of NCAA Division I rosters consistently shows average team ages approaching or exceeding 23 years old. Older rosters mean longer player tenure — and longer tenure means fewer annual intake opportunities.
This is the same math that governs Division III slot pressure.
When rosters age, the annual number of new seats shrinks, even if total roster size stays constant.
4) Why This Cascades Downward
When Division I becomes harder to access:
-
Tier II players face stiffer competition for D1 slots
-
More Tier II players land in NCAA Division III
-
Competitive D3 programs fill from the top down
-
Remaining space for Tier III pathways compresses further
At this point, this is not theoretical. The Tier III pressure model is best understood as downstream math, not failure of any league or program.
Final Thought
The most important takeaway from this analysis is not that any single pathway is "good" or "bad." It is that college hockey outcomes are governed by fixed capacity and increasing competition — and that pressure always redistributes downward.
At every level, roster spots are finite. When more experienced players enter the system at the top, fewer opportunities exist below. That pressure does not disappear. It simply moves.
For Tier III players, especially those in the NA3HL and USPHL Premier, this means NCAA Division III can no longer be treated as a default outcome — even for exceptional resumes. When D3 opportunities exist, they are far more likely to come from the lower half of the division, and they increasingly compete on cost, experience, and value with well-funded ACHA programs.
In today’s landscape, labels alone are no longer sufficient proxies for outcomes. The difference between pathways is no longer binary — NCAA vs ACHA — but contextual: quality of program, competitive environment, financial value, and player experience.
The pressure model doesn’t argue against Tier III hockey. It argues for advising that reflects the actual math of the system players are entering.
Afterword: Methodology & Data Notes
Data Source:
-
Player-level NCAA D3 roster data (active 2025–26 season)
Tier Definitions:
-
Tier III (Core): NA3HL, USPHL Premier
-
EHL excluded from core Tier III conclusions
Normalization:
-
Active players divided by 4 to estimate annual slot availability
Team Strength:
-
MYHockeyRankings NCAA D3 Men’s rankings
Key Assumptions:
-
Average NCAA D3 career length ≈ 4 years
-
Roster sizes ≈ 25–27 players
-
Focus on structural trends, not individual outcomes
This model is intentionally conservative.
If anything, future eligibility changes are likely to make these conclusions more pronounced — not less.